The pulse: the 7 key workforce planning metrics – and how to measure them
You usually only notice whether a roster is good when it fails: a shift stays empty, temps cancel at short notice, dispatch spends half the day on the phone. A handful of metrics makes workforce planning measurable – and improvable. Here are the seven most important, each with formula, worked example and typical causes of poor values.


Short answer: which metrics matter?
The seven key workforce planning metrics are fill rate, lead time to fill, no-show rate, cancellation rate, cost per shift, overtime rate and weekly planning effort. Together they show whether you have enough staff, how reliable they are and what planning costs. The worked examples in this post are illustrative and not industry benchmarks.
1. Fill rate
Formula: filled shifts ÷ planned shifts × 100. Example: 190 of 200 shifts filled = 95%. Poor values usually come from posting too late, unclear availability or a temp pool that is too small. Fill rate is the single most important metric, because every empty shift directly costs revenue or service quality.
2. Lead time to fill
Formula: time the shift is filled minus time it was posted, averaged over all shifts. Example: a shift is posted Monday at 9:00 and accepted Monday at 9:03 – lead time 3 minutes. Long lead times point to slow communication channels: phone chains, group chats without clear ownership, back-and-forth by email.
3. No-show rate
Formula: staff who did not show up ÷ scheduled staff × 100. Example: 4 no-shows in 200 assignments = 2%. No-shows are expensive because they happen at short notice and without warning. Common causes are weak commitment (a thumbs-up in a chat), missing reminders and shifts that were assigned to staff rather than chosen by them.
4. Cancellation rate
Formula: short-notice cancellations ÷ accepted shifts × 100. Example: 10 cancellations in 200 acceptances = 5%. Define what 'short notice' means for you (e.g. less than 48 hours before). A high cancellation rate shows that planning and actual availability are drifting apart – often because shifts are firmly assigned too far in advance.
5. Cost per shift
Formula: total monthly planning and staffing overhead ÷ number of filled shifts. Besides software, this includes dispatch working time, phone costs and agency costs for replacement staff. Example: €1,800 total cost ÷ 600 shifts = €3.00 per shift. This metric shows what 'planning on the side' really costs.
6. Overtime rate
Formula: overtime hours worked ÷ planned working hours × 100. Example: 120 overtime hours in 2,400 planned hours = 5%. Rising overtime among core staff is often a symptom of a low fill rate for temps: if you cannot fill shifts, you extend the shifts of those already there.
7. Weekly planning effort
Formula: hours dispatch and management spend each week on planning, chasing and re-planning. Example: 3 people × 6 hours = 18 hours per week. This metric is rarely measured but is often the biggest hidden cost. A simple approach: log every planning task with the time of day for two weeks.
See these metrics live: PULS in SmartChilli
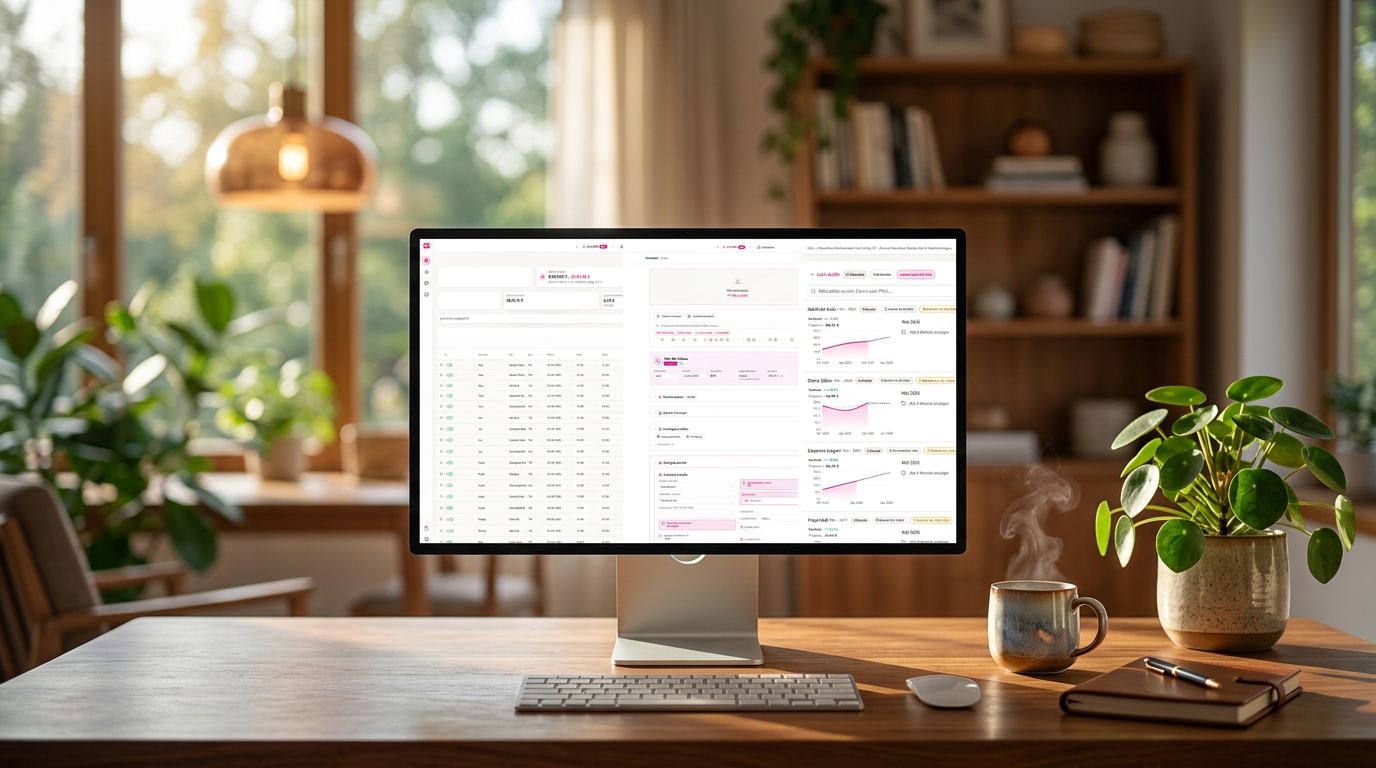
If you do not want to piece the metrics together in Excel: SmartChilli tracks them automatically and calls them PULS. Dispatchers and managers see every day whether the order is staffed, how many confirmations came in this week and what share of the next seven days is already covered. Per billing period, PULS shows scheduled hours, secured shifts, fill rate, coordinated staff and the coordination effort saved. Staff see their own pulse too: jobs, hours worked and open jobs. How the metrics in this article map to PULS: • Fill rate → "Fill rate" and "% of the next 7 days staffed" • Lead time → "Looking ahead: hours already scheduled and confirmed shifts" • No-show and cancellation rate → "Confirmations", "Latest confirmations" and fully documented job offers • Cost per shift → "Cost per coordinated working hour" • Planning effort → "What SmartChilli took off your plate"
- Arena · home game, Staff member A.12 h ago
- Trade fair · setup, Staff member B.13 h ago
- Catering · evening event, Staff member C.13 h ago
- Job requests sent12,334
- Responses processed6,757
- Team notifications4,203
Example values for illustration
How to start measuring
Start with three metrics: fill rate, no-show rate and planning effort. Measure the current state for four weeks before changing anything. Then set a realistic target and review it monthly. Important: metrics only work with clean data – acceptances, cancellations and actual working hours must be recorded in one place, not spread across chats, lists and notes.
FAQ
What is the most important workforce planning metric? Fill rate, because every empty shift directly costs revenue or quality. – How do I calculate the no-show rate? Staff who did not show up divided by scheduled staff, times 100. – How often should metrics be reviewed? Monthly, and additionally before and after peak periods if your business is highly seasonal.
Ready to drop the gut feeling?
Try SMARTCHILLI free for one month and experience scheduling without guesswork.
Book a live demoComments
- No comments yet – be the first!